
We appreciate that reading about these capabilities is not the same as seeing them in action. Many of you want more than just our word to believe in the value and power of LeanXcale. That’s why we present our latest demo as a video.
The demo
Components
- Two small servers (4 cores and 16GB of memory) with a LX instance.
- A BI tool, in this case, Apache Superset.
- The New York City taxi dataset.
- An additional server with which we perform a Java method to add ratings to the original dataset randomly.
What you will see in this demo
After a brief introduction, the demo begins ingesting the dataset, which lasts for approximately 25 minutes to import all 160 million records.
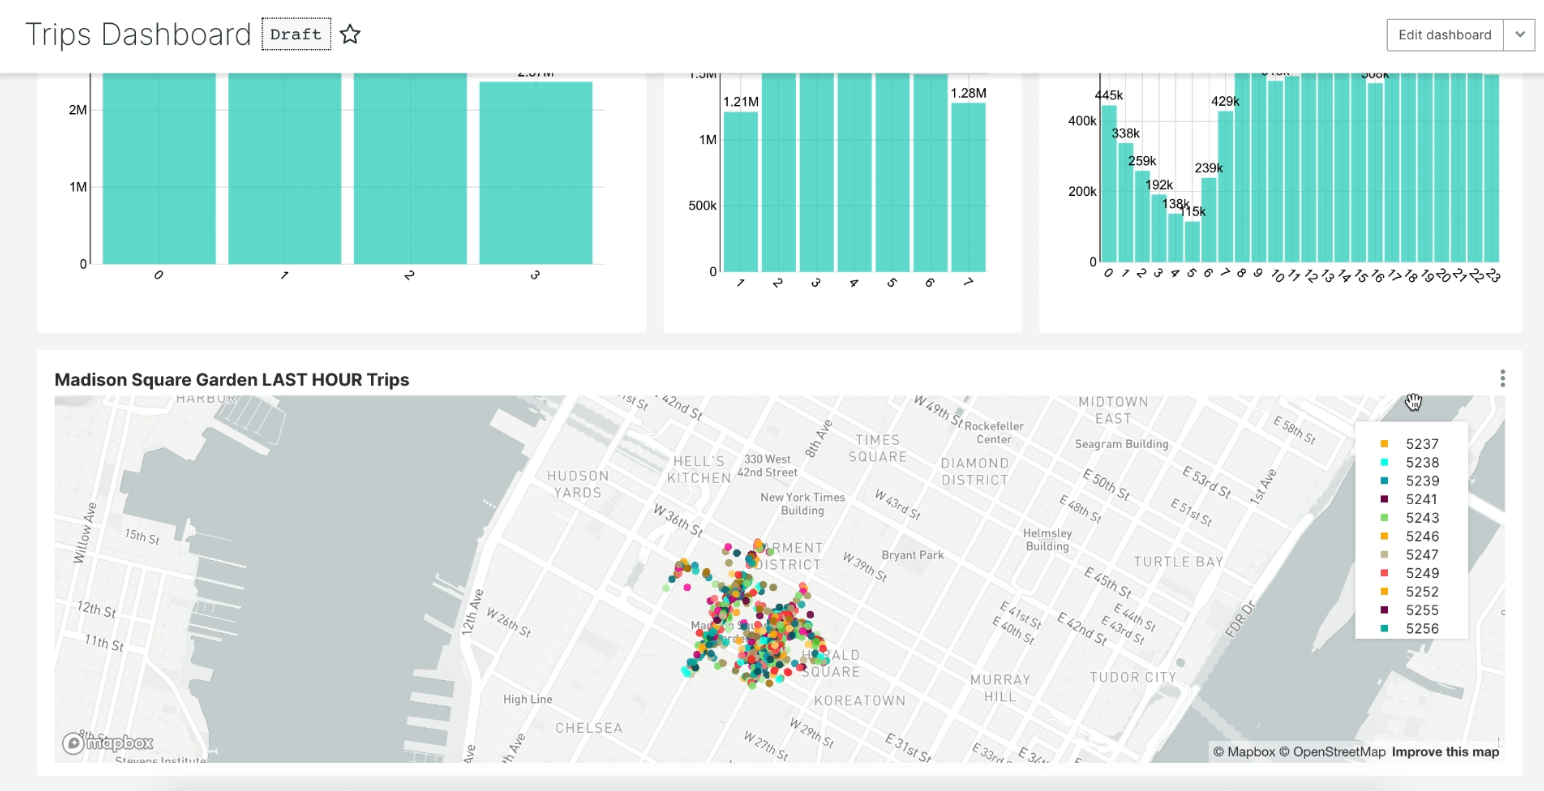
During the import, we also present the Apache Superset dashboard that includes six real-time visualizations of the incoming data:
- The number of ingested trips.
- A ranking of the top five best drivers, according to the ratings added by the Java method.
- The number of passengers and trips grouped by the taxi companies.
- An aggregation of trips per week of the year.
- An aggregation if trips per day of the week.
- An hourly aggregation of trips.
The top five rating chart is especially interesting because it offers valuable business information, and is also technologically demanding. The query must go through the entire table to group the real-time data by the driver, calculate the average, order the results, and return the top five records. This operation would be challenging for many other databases but is easily performed by LeanXcale leveraging online aggregations.
Of course, it is better for you to see with your eyes, so here is the video. Enjoy!