
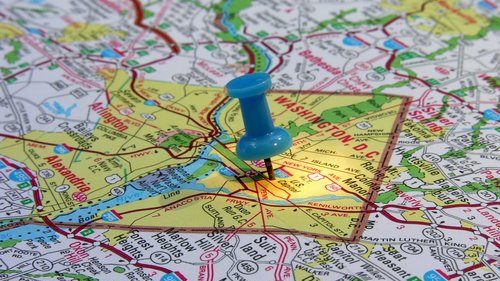
Geospatial data refers to objects (in the wide sense of the object word) that may have a representation on the surface of the earth. These representations can be locations (points), paths, areas, or any kind of information that is capable of being represented in a map. As these kinds of objects may be static in the short term or dynamic in real time, geospatial data combines objects with metadata, such as specific attributes or temporal information, to try to build a complex environment ready to be analyzed. In this context, the concept of geospatial big data arises. Today, because of databases’ limitations (among other reasons), it is difficult to fully exploit a significant volume of geospatial data in many applications.
LeanXcale offers support for geospatial data through the use of specifically created ST functions to handle geospatial data using SQL. Combined with LeanXcale’s capacity for bottleneck elimination in transactions and linear instance scaling, we now have the capability to store and load geospatial data to and from LeanXcale in a single instance, suppressing the need for ETLs and data transport between instances.
To try to illustrate this new GIS support feature, we have developed a GIS support demo, which I would like to share in this post. It is a simple demo, in which we are going to store geospatial data (specifically, geospatial points) in LeanXcale and visualize them in real time over a map.
Currently, LeanXcale supports Geometry and Geohash functions, as described in the documentation.
COMPONENTS
We need:
- A LeanXcale (LX) database instance. You can find it here.
- A business intelligence tool to visualize geospatial data.
- A nice dataset.
- A program that simulates geospatial data insertion on LX.
LeanXcale will soon be released with a fully integrated BI tool, based on Apache Superset. Thus, LeanXcale will offer a SQL client integrated on its own and with a very complete set of visualizations ready to easily be created by a non-expert user with some SQL knowledge. So, the chosen BI tool to visualize data is Apache Superset.
In terms of obtaining a nice dataset, after some research, we found this work research group with access to some datasets handling geospatial data. Mobile Century was an experiment conducted at UC Berkeley to test the potential to use GPS data to estimate traffic conditions. The dataset contains 8 hours of GPS trajectory data from 100 vehicles on a ~10-mile stretch of I-880 in California, as well as inductive loop detector data from PeMS, and travel times recorded by license plate recognition. What we are going to simulate is real-time movement of a subset of vehicles (20 vehicles) according to this dataset.
In terms of a program that simulates geospatial data insertion, we chose Java with Spring Boot to load CSV data from the Mobile Century dataset. A state machine has been implemented with states running, stopped and to-clear, and it replies to http get calls to run, stop, or restart the demo.
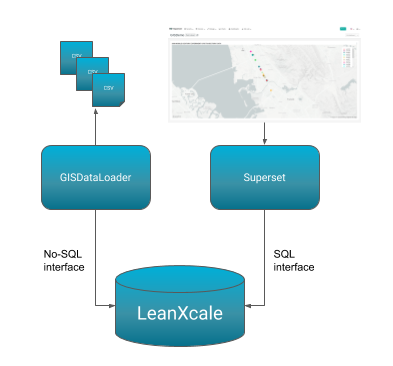
ARCHITECTURE
So, let’s go. We are going to benefit from LeanXcale’ s versatility, in which we can use either a No-SQL or a SQL interface. The data loader will use the LeanXcale supplied library for No-SQL inserting, handling tuples instead of SQL queries. Conversely, the Superset BI tool will use SQL queries to extract the data to be visualized. So the architecture follows the next schema:
DATA LOADER
Let’s do a little code design for GISDataLoader. Loader will create a thread pool in which each thread will take a vehicle position data CSV, read it, and insert a new tuple given a period of time. This way, we can simulate data ingestion on LeanXcale.
As previously described in our streaming twitter post, the KiVi library is not available from a public repository, so we have to install the LX all-dependencies jar in our local repository and define the dependency as follows:
mvn install:install-file -Dfile=kivi-api-0.96-SNAPSHOT-direct-client.jar -DgroupId=com.leanxcale -DartifactId=kivi-api -Dversion=0.96-SNAPSHOT -Dpackaging=jar

    <dependency>
      <groupId>com.leanxcale</groupId>
      <artifactId>kivi-api</artifactId>
      <version>0.100-SNAPSHOT</version>
    </dependency>
We also need Geotools for Java, so let’s add the necessary repos and dependencies:
<repository>
            <id>osgeo</id>
            <name>Open Source Geospatial Foundation Repository</name>
            <url>http://download.osgeo.org/webdav/geotools/</url>
</repository>
<repository>
          <snapshots>
            <enabled>true</enabled>
          </snapshots>
          <id>boundless</id>
          <name>Boundless Maven Repository</name>
          <url>http://repo.boundlessgeo.com/main</url>
</repository>
<dependency>
            <groupId>org.geotools</groupId>
            <artifactId>gt-shapefile</artifactId>
            <version>23-SNAPSHOT</version>
</dependency>
<dependency>
            <groupId>org.geotools</groupId>
            <artifactId>gt-swing</artifactId>
            <version>23-SNAPSHOT</version>
</dependency>
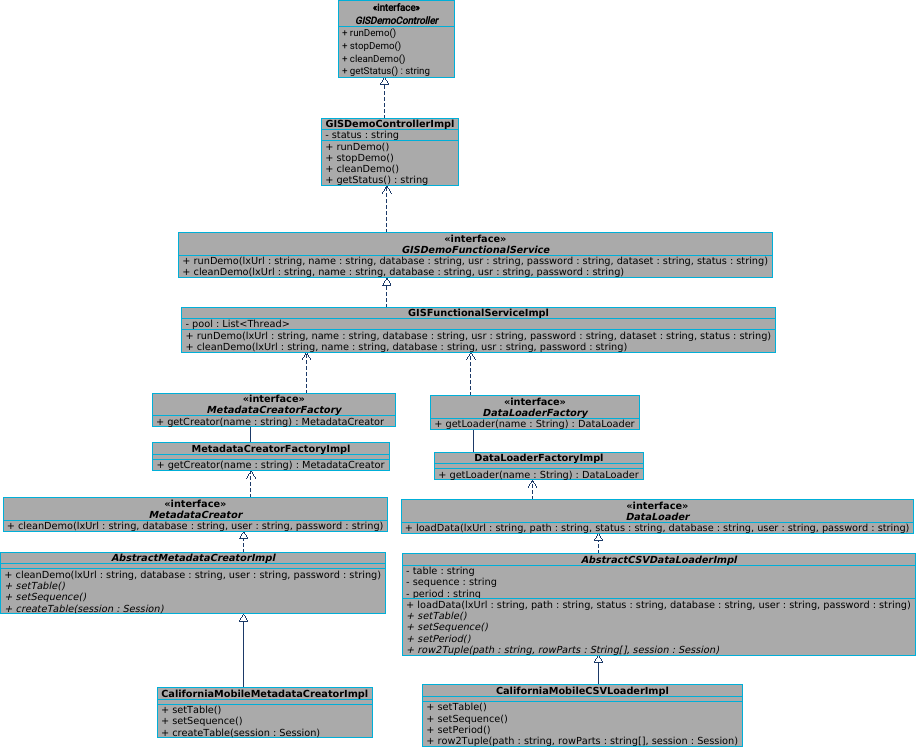
Code design, without going into extensive detail at this point, follows the next diagram. Note that code is prepared for easily adding new dataset loaders by adding configuration to properties files and implementing the MetadataCreator interface (to create the database schema) and DataLoaderInterface (to properly load the data). If we wished to store more CSV-based data, it would only be necessary to extend abstract classes and implement concrete abstract methods.
You can find source code here.
An important thing to note is the use of the No-SQL API. When implementing createTable, we have to make use of the KiVi library, in this way:
@Override
    public void createTable(Session session) {
        // Gets the database object (to access the schema)
        Database database = session.database();

        // Checks the existence of the table
        if (!database.tableExists(getTable())) {

            // If the table does not exist create it.
            database.createTable(getTable(),
                    Collections.singletonList(new Field("ID", Type.LONG)), // PK
                    Arrays.asList(new Field("VEHICLE", Type.STRING), new Field("MOMENT", Type.TIMESTAMP),
                            new Field("LOCATION", Type.STRING),new Field("SPEED", Type.DOUBLE)));
        }
    }

    @Override
    public void setTable()


    @Override
    public void setSequence()
This code corresponds to the following SQL sentence:
create table GPS (
  ID BIGINT NOT NULL,
  VEHICLE VARCHAR NOT NULL,
  MOMENT TIMESTAMP NOT NULL,
  LOCATION  VARCHAR,
  SPEED NUMERIC(3,3),
  CONSTRAINT PK_GPS PRIMARY KEY (ID)
);
Besides, the GPS_ID_SEQ sequence is automatically created in the abstract parent class.
When implementing the row2Tuple method, in addition to making use of the GeoTools library, we have to again make use of the KiVi library, in this way:
@Override
    public Tuple row2Tuple(String path, String[] rowParts, Session session) {
        // CSV FORMAT: unixtime(long);latitude(double);longitude(double);speed(double)
        // Position in WKT
        GeometryFactory geometryFactory = new GeometryFactory();
        Coordinate coords = new Coordinate(Double.parseDouble(rowParts[1]),Double.parseDouble(rowParts[2]));
        Geometry point = geometryFactory.createPoint(coords);
        WKTWriter writer = new WKTWriter();
        String position = writer.write(point);
        // Get next sequence value
        Sequence idSeq = session.database().getSequence(getSequence());
        long nextSeqVal = idSeq.nextVal();
        // Create timestamp
        Timestamp t = new Timestamp(Long.parseLong(rowParts[0]));
        // Get vehicle id
        Pattern pattern = Pattern.compile("\\w+/\\w+/(\\w+).\\w+");
        Matcher matcher = pattern.matcher(path);
        String vehicleId = null;
        if (matcher.matches()) {
            vehicleId = matcher.group(1);
        }
        // Generate tuple to insert
        Table table = session.database().getTable(getTable());
        Tuple tuple = generateTuple(table, nextSeqVal, vehicleId, t, position,
                Double.parseDouble(rowParts[3]));
        // Insert tuple
        System.out.println("Thread inserting record from csv " + path + " with id " + nextSeqVal);
        return tuple;
    }
The tuple format matches the previously created table structure.
SUPERSET BI TOOL
As previously indicated, Apache Superset comes bundled with each LeanXcale instance, so you can use it directly or install it in a separate server following these steps.
Superset runs with Python 3, so you’ll need the LeanXcale Python SQLAlchemy driver. You can download it from here and install it by using this pip3 command:
pip3 install pyLeanXcale-1.4-py3.whl
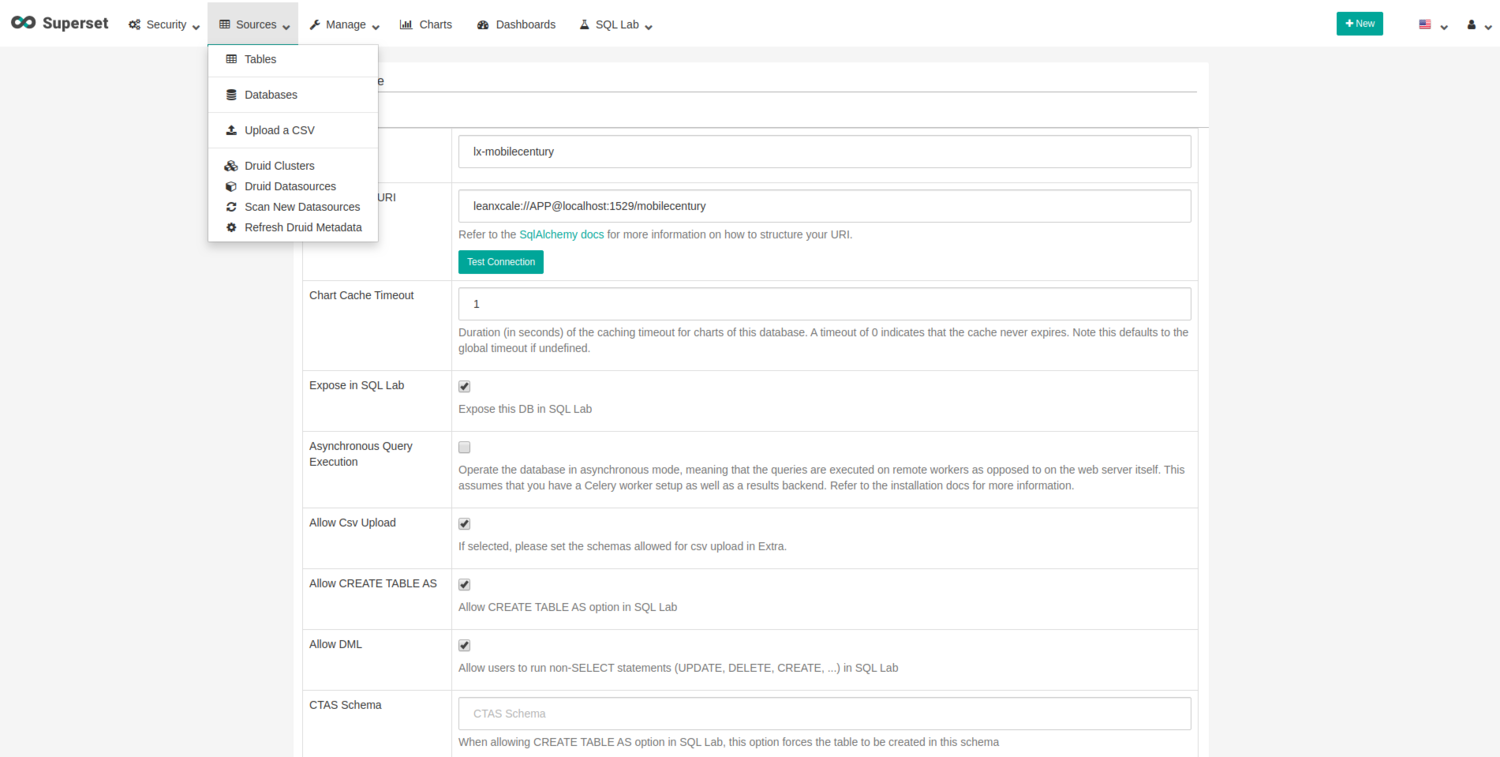
The next step is to configure LeanXcale access from Superset. Navigate to “Sources/Databases”, click on the “+” button, and fill in the datasource name (local-lx-mobilecentury) and the SQLAlchemy URI (leanxcale://APP@:1522/mobilecentury). Mark all ticks except “Asynchronous Query Execution” and save the changes.
To configure the table, please navigate to “Sources/Tables”, click on the “+” button, and fill in the fields with the recent created database connection, the schema (APP), and the table name (GPS). Save the changes.
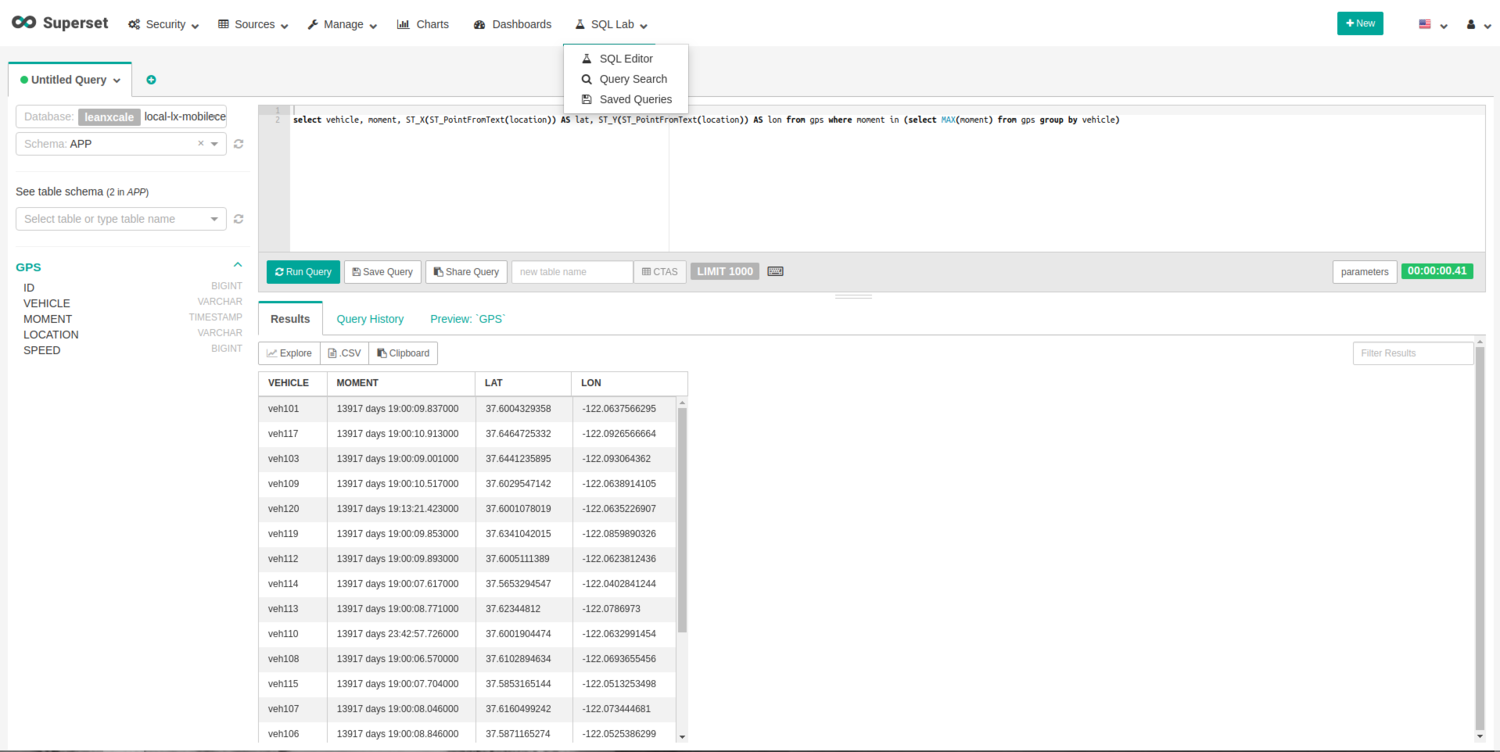
Let’s now configure the chart to visualize vehicle movements in real time. First of all, we have to define the SQL query that Superset is going to execute. We will use the Geometry functions provided by LeanXcale, and this is the query:
select vehicle, moment, ST_X(ST_PointFromText(location)) AS lat,
ST_Y(ST_PointFromText(location)) AS lon from gps where id in (select MAX(id) from gps group by vehicle)
We are obtaining the last inserted row using the auto generated id field. Please note that this query is making use of LeanXcale implemented geospatial functions. Specifically, we are building a Point type from a WKT text before extracting X and Y coordinates.
So, using Superset, let’s visualize the query results. Navigate to “SQL Lab/SQL Editor”. On the left part of the view, fill in the appropriate values (Database=local-lx-mobilecentury, Schema=APP, Table Schema=GPS). This will yield a data preview. Next, type the query, and click on “Run Query”:
To export query results and create a chart to visualize, click on the “Explore” button. The view to configure a chart will be displayed.
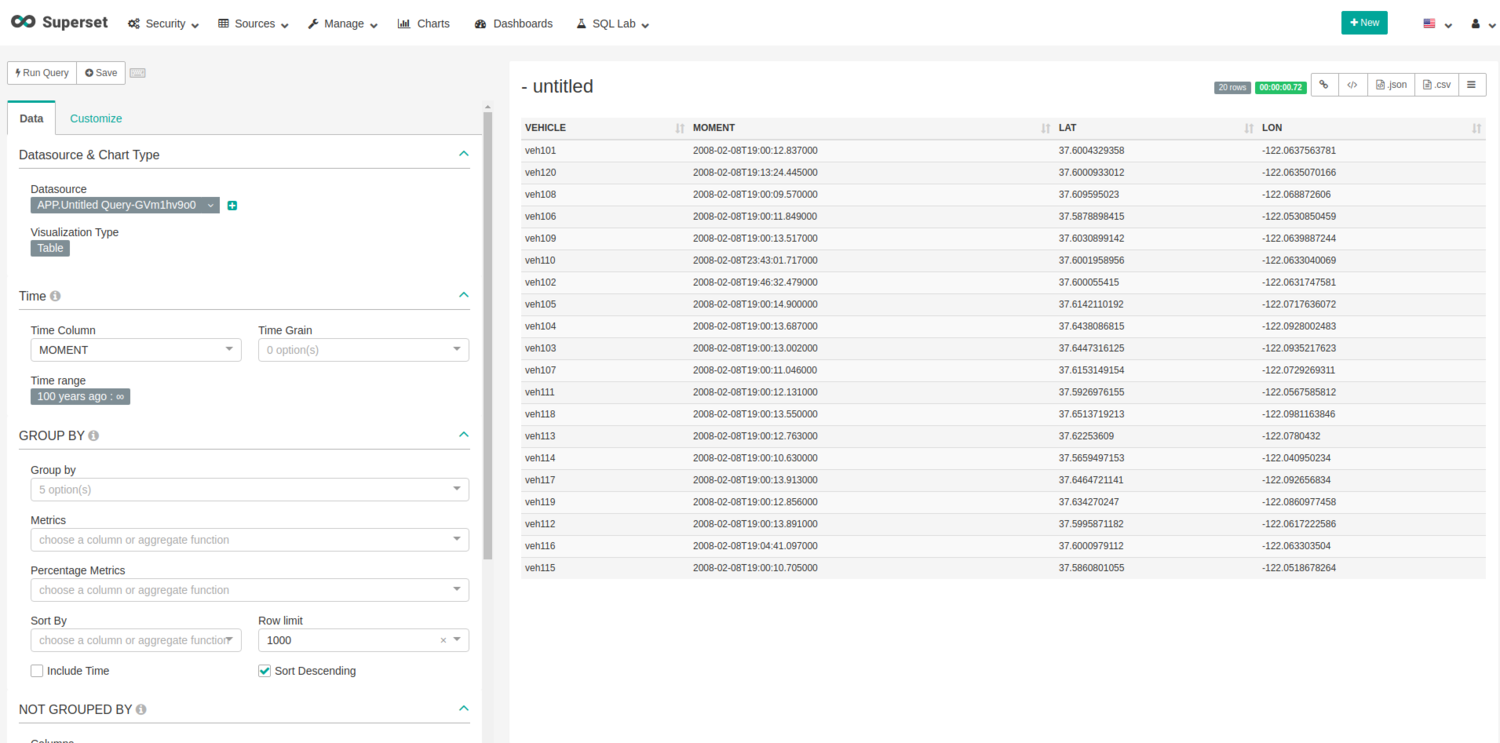
Click on the button under “Visualization Type” (now it is displaying “Table”) and select “deck.gl Scatter plot”. This is a preconfigured visualization to draw position in maps, which uses Mapbox. Actually, it is necessary to request an API key for Mapbox and register it for Superset with the name “MAPBOX_API_KEY”. As it is an environment variable, you can set its value wherever you wish.
Once “deck.gl Scatterplot” is selected, fill in the fields in the left part of the view with the appropriate values. The important ones are latitude and longitude:
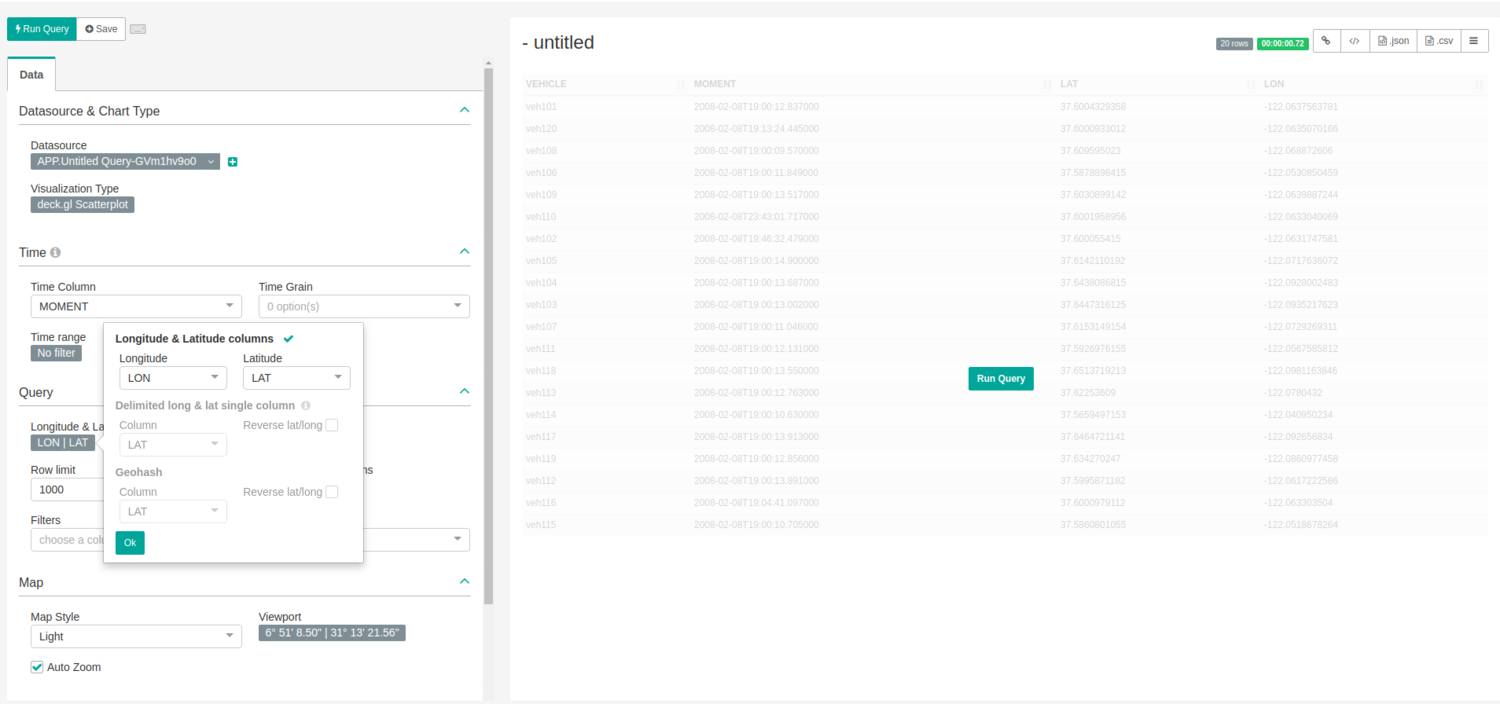
You can then play with the rest of the options to change visualization, map zoom, point radius, and colors, etc. In this demo, we are choosing the following options:
-Without auto zoom.
-Point size: 150, radius in meters.
-Point color: categorical, with Dimension Vehicle.
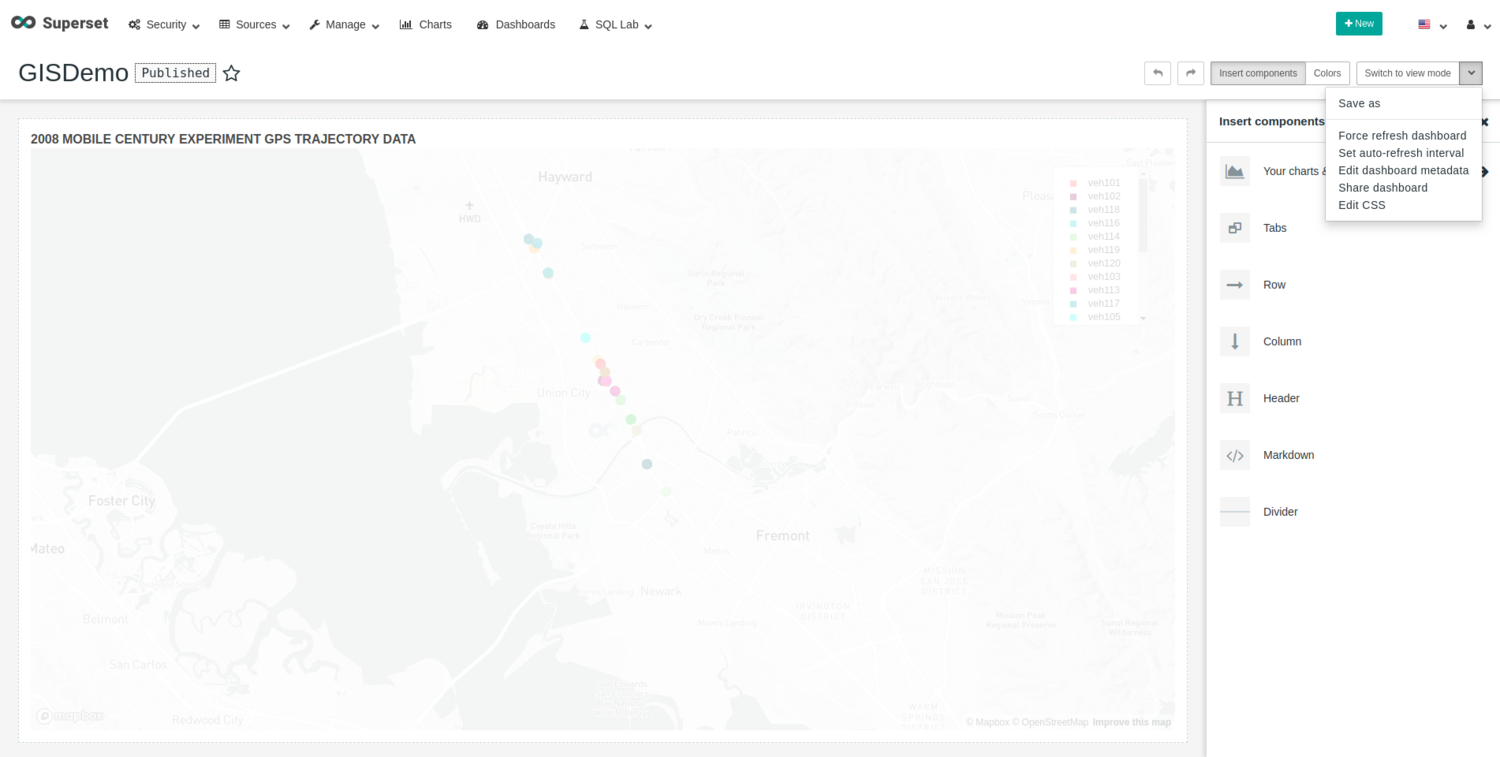
When you have finished, click on the “Run Query” button. Select appropriate zoom over the map and click on “Save”. We will save this chart with “2008 MOBILE CENTURY EXPERIMENT GPS TRAJECTORY DATA” as the name and also add it to a dashboard with the name “GISDemo”.
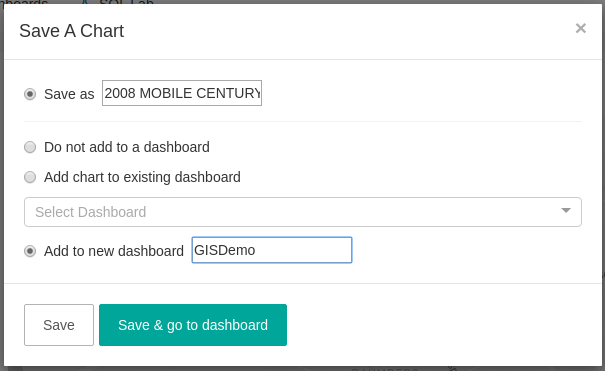
After clicking on “Save and go to dashboard”, we are redirected to the dashboard page, on which we can set the chart size, among other things. To change some other settings, it is necessary to save the dashboard first, so give it a name, and click on “Save” on the right corner.
Now that the dashboard has been saved, let’s set the dashboard refresh interval. Click on “Edit dashboard”, and then click on the arrow to the right of the “Switch to view mode” button and select “Edit dashboard metadata”. Note that there is a field to set the auto refresh interval. By choosing this option, however, we can only select from a set of values. So, let’s edit the metadata and configure the desired number of seconds to refresh.
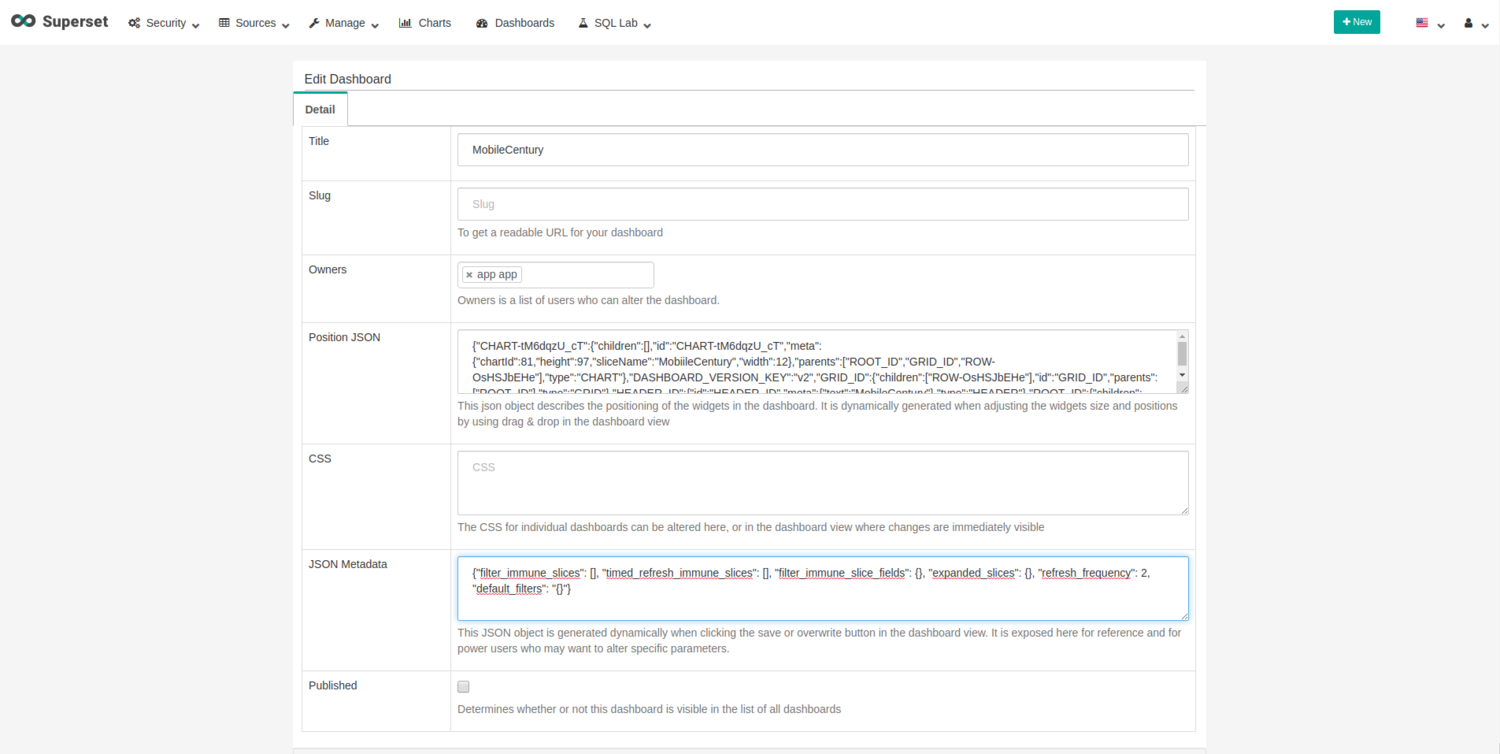
Modify the refresh frequency to 2 seconds in the “JSON Metadata” field and save the changes.
We’re almost done! Now run the loader:
mvn spring-boot:run
or
mvn clean package
java -jar GISDemo-0.0.1-SNAPSHOT.jar
Next, with your favorite HTTP client, send a clean request for creating the database structure:
http://dataloader_server_ip:8080/GISDemo/clean
Next, send a run request:
http://dataloader_server_ip:8080/GISDemo/run
The run request will start the insertion, and, at the same time, we can visualize the movements on our dashboard.
You can stop the demo whenever you want with the following request:
http://dataloader_server_ip:8080/GISDemo/stop
You can then recreate the database structure, using the clean request, whenever necessary.
WRITTEN BY

Sandra Ebro Gómez
Software Engineer at LeanXcale
10 years working as a J2EE Architect in Hewlett-Packard and nearly 2 years working in EVO Finance and The Cocktail as a Solution Architect. Now part of LeanXcale team, trying to look for and develop the best usecases for high escalable databases.