
Motivation: Support Any Historical Monitoring Data Depth with High Efficiency
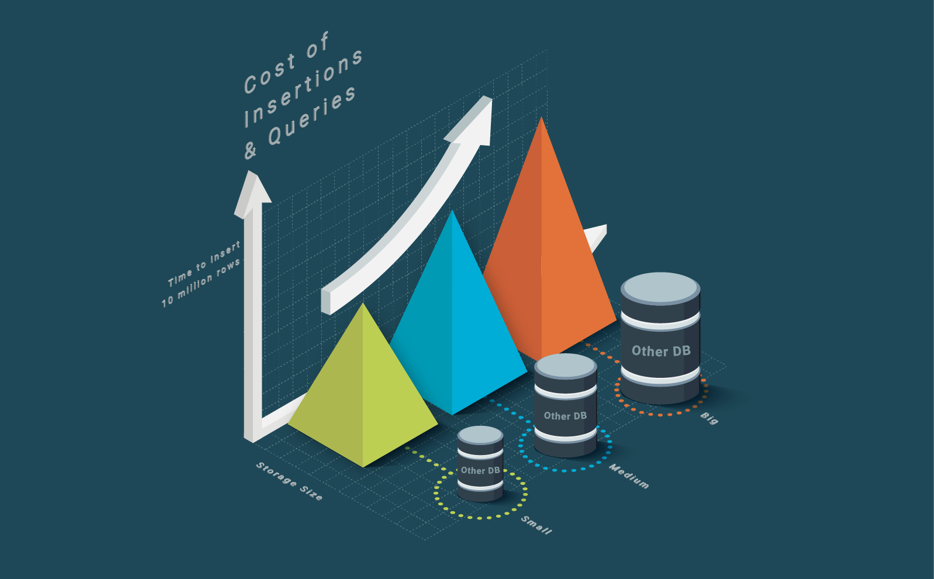
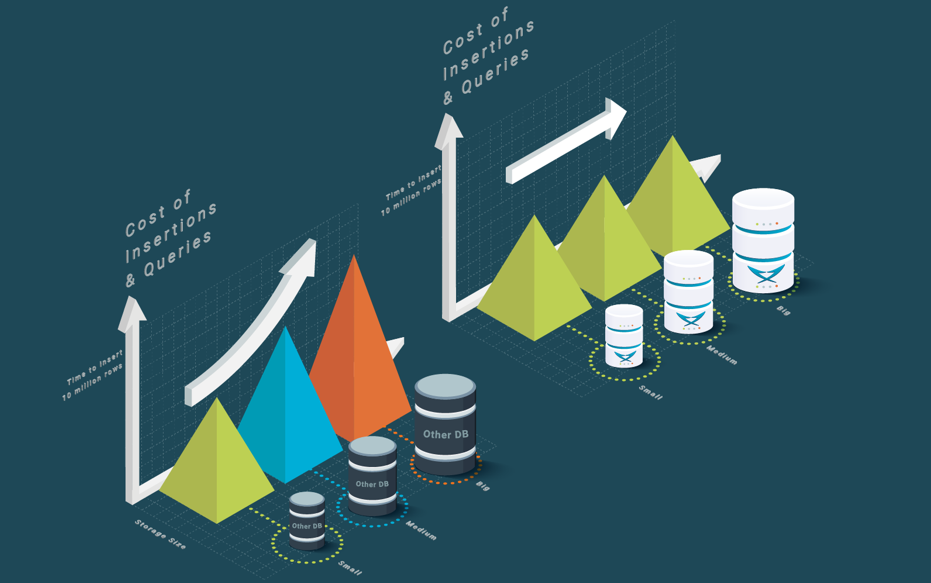
One of the main tasks of a monitoring tool is to collect historical data. Tracking historical data allows companies to forecast their future needs and have a basis to identify anomalies and problems. Historical monitoring data involves high data volume, especially when monitoring large amounts of customer applications (APM), network data (NPM) or large-scale systems such as data centers (ITIM). This high data volume implies large data structures to store the data. When the historical data increases, the ingestion and query performance of these data structures decreases. In Figure 1 it can be seen that existing databases take longer to ingest the same amount of data (e.g., 10 million rows) as the database grows bigger. As a result, the Total Cost of Ownership (TCO) of a monitoring tool is highly impacted when dealing with historical data since a bigger HW footprint is required:
- to monitor the same number of items;
- to maintain the same User experience (UX) of the User Interface (UI);
- or to provide the same analytic capabilities that impact the Mean-Time-To-Repair (MTTR).
Why Such Inefficiency Appears as Historical Data Grows
An SQL database represents data using a B+ tree, which grows in number of levels as the data volume grows. When the B+ tree does not fit in the database cache, ingesting data becomes expensive, because inserts are required to bring the leaf nodes from disk to memory for one, or multiple, rows. Querying data with time locality (e.g., recent monitoring data) does not yield any benefit because reads are not local and are sparse across the B+ tree.
On the other hand, NoSQL key-value databases typically resort to SSTables (String Sorted Tables), a data structure pioneered by Google BigTable. SSTables are efficient at ingesting data but reading data is inefficient, with an order of magnitude more expensive reads. This is both in terms of blocks read from persistent storage as well as in number of key comparisons performed to find the target row.
Thus, historical data means less efficient processing and/or higher cost for more hardware to achieve the same performance as with current data.
Why Bidimensional Partitioning
One differential key feature of LeanXcale is bidimensional partitioning, a new technology to ingest data at fast speed, independently of data volume. This technology enables it to partition data regions automatically upon some size threshold. The data structure used to store the data keeps a maximum size that enables inserting data very efficiently in its memory. The technology enables it not only to ingest data efficiently, but also to query data efficiently. The bidimensional partitioning splits data according two dimensions: primary key and time (or an auto-increment counter). The first dimension, the primary key, allows it to perform queries efficiently, since it guarantees locality on a single server for short range scans over the primary key. The second dimension guarantees fast data ingestion by keeping the hot data in a data structure that is small enough to ingest data in memory.
Let’s now see how SQL and NoSQL databases and LeanXcale handle large historical data.
Problems with Ingesting Data in SQL and NoSQL Databases
SQL databases use B+ trees to store the data (see Figure 2). A B+ tree is an n-ary search tree. Data is actually only stored on the leaf nodes.
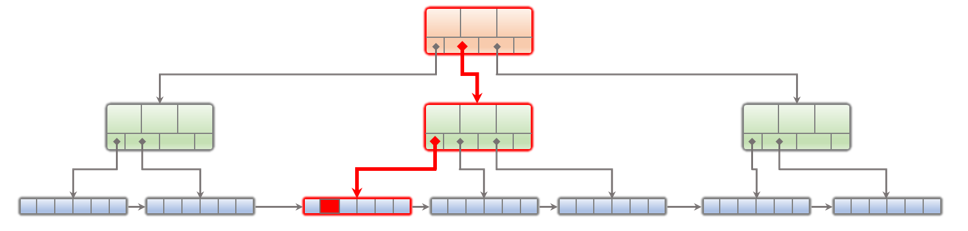
The intermediate nodes only store keys to enable performing the search. When the B+ tree grows in number of nodes and levels, eventually only a fraction of the nodes fits in the block cache (see Figure 2). When this happens, sparse insertions result in having to read a leaf node from persistent storage and having to write one leaf node to make space in the cache. That is to say one read and one write for inserting one row. If the B+ tree grows bigger in number of levels, additional nodes need to be read to reach the leaf node. This means that ingesting data becomes slower and slower as data volume increases.
NoSQL databases that are not key-value use a different data structure than a B+ tree, but still encounter a similar problem to SQL databases; it becomes more expensive to store the same amount of data as the table size grows. In Figure 3, we can see the evolution of the cost of ingesting 10 million rows as the database size grows for both SQL and NoSQL databases. The SQL database which we used is a leading database, while the NoSQL database was MongoDB. Figure 3 shows that, as the database grows in millions of rows, each one of the additional ingested 10 million rows takes longer due to the increasing cost.
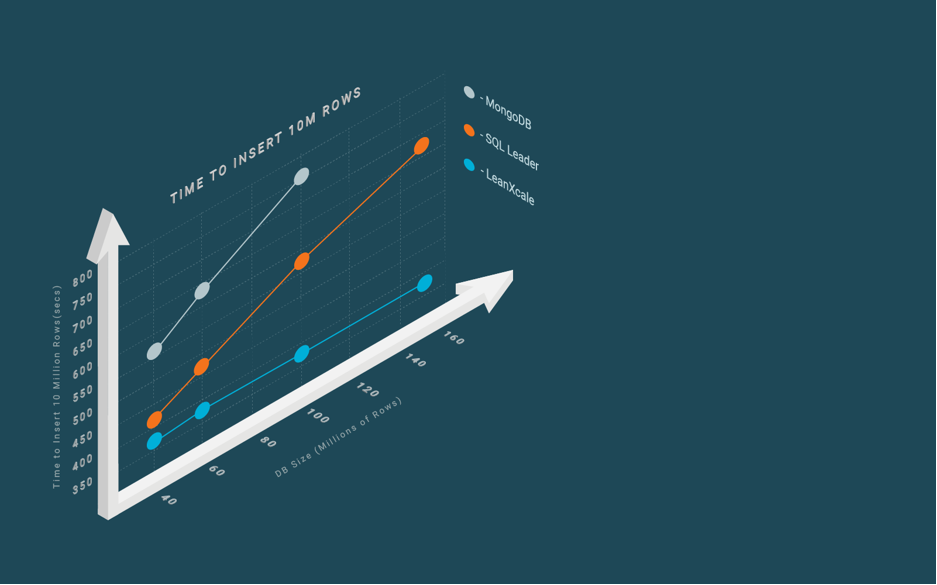
On the other hand, key-value databases, using SStables, face the inefficiency of having a particular horizontal data partition split across many different files. All these files have to be read to be able to perform the range query. This results in more than an order magnitude of inefficiency when reading data (see blog post on High Ingestion).
LeanXcale Bidimensional Partitioning
LeanXcale solves the problem using bidimensional partitioning. Tables are horizontally partitioned, according to the primary key, into ranges of the primary key. Each table partition is then partitioned on a second dimension, time. When the table partition reaches a threshold size, it is split into two partitions: one partition that corresponds to the current range of time values that will contain all rows stored up to now, and one partition that corresponds to the range of time values from the highest time value stored in the other partition onwards. Since time progresses monotonically, the blocks of the first partition become cold and are evicted from the cache, while the latter partition becomes hot and is kept in the cache. This happens because the former partition was evicted as it became cold.
The interesting fact about bidimensional partitioning is that query efficiency is preserved. This is because searches for monitoring data involve the primary key and a time range. Thus, LeanXcale only needs to perform the search in the actual table partitions that contain data involved in the search. Therefore, the efficiency of queries is maintained, while highly reducing the cost of ingesting data that does not increase with the data volume.
How Bidimensional Partitioning Works
Let’s look at an example of how bidimensional partitioning works. LeanXcale always ingests data into a hot partition located in the memory, so the ingestion is performed at the optimal velocity. When the in-memory partition has grown enough, a brand-new partition is created by splitting the time dimension of the current one and the former partition gets cold and is written to persistent storage. The stored data has a lot of locality according to the two main monitoring search criteria: time and monitored item (see Figure 4.c).
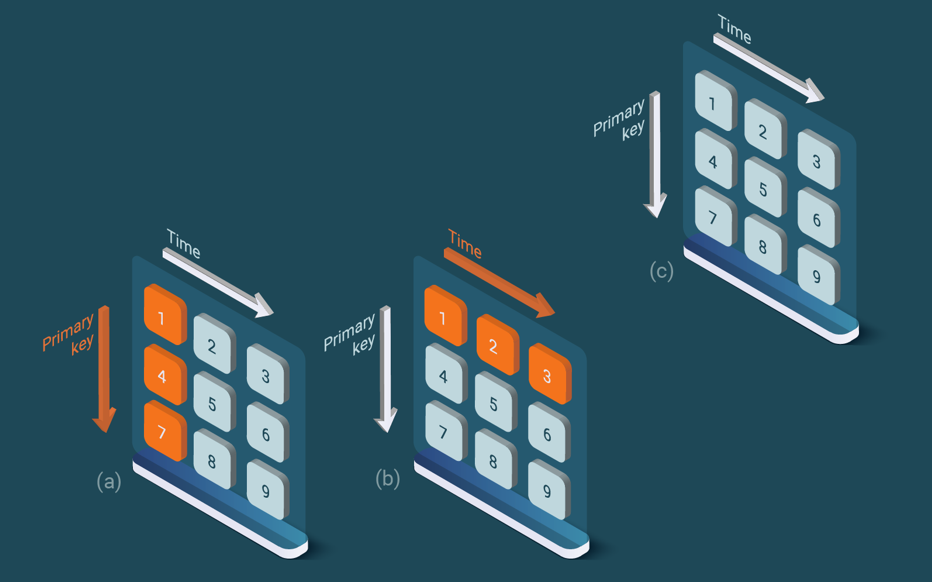
To query a monitored item time-series, the primary key is provided together with the time range (see Figure 4.c). The primary key determines which storage server contains the data (see Figure 4.a). The time range determines from which bidimensional partitions data should be read (see Figure 4.b). The access is very efficient since only the relevant data is accessed.
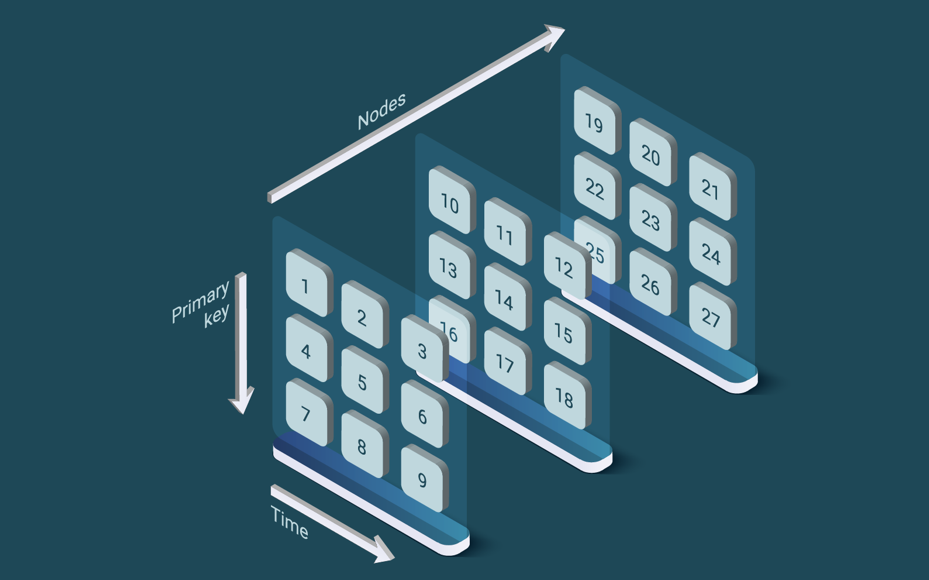
Similarly, when a query retrieves data from a period for a set of monitored items, only the relevant subset of partitions is actually accessed. As can be seen from all the data in a primary key range, only a small subset of bidimensional partitions is accessed; either to recover a time series for a monitored item or data from a period about a set of monitored items. Since LeanXcale is a scalable distributed database, the speed of ingestion and querying increases by adding more nodes to the system as can be seen in Figure 5.
An Example: Performance Monitoring
In performance monitoring, a large amount of data needs to be ingested in a continuous manner. The main usages are dashboarding, error detection, troubleshooting and capacity planning. In all of these cases, it is necessary to access both current and historical data.
From a data point of view, the collected data shares the following set of characteristics:
- Insertions:
- Collected data has the timestamp indicating when the event happened.
- Collected data has, as part of the primary key, the unique identifier of the monitored item.
- The data is mostly collected in real-time. In other words, the data is received mainly with a lot of locality on the timestamp column, i.e., rows with close timestamp arrive around the same time.
- In some situations, the data is received out of order, mainly because the clock of the different agents, probes or devices are not synchronized and/or due to different delays in the data pipelines, or disconnections/incidences at data sources.
- When there are network/visibility problems, data is received in bulk, but still sorted by time.
- Queries:
- Most the select queries use WHERE, GROUP BY or ORDER BY clauses involving the timestamp column and the primary key.
- They are related to an item or a group of them.
- Deletions:
- The retention policies are time-oriented, e.g., the information related to the front-end servers is stored for three years.
- The deletion is commonly bulk oriented.
- Updates:
- Monitoring tools almost never update collected data.
These features are common in Time Series. Additionally, data in a monitoring system is frequently inserted and accessed also in an aggregated way (to show dashboards or to calculate aggregate items, for example).
How Bidimensional Partitioning Boosts Monitoring Data Workloads
Now that we have described the typical data workload generated by a monitoring tool, let’s examine how bidimensional partitioning boosts the workload.
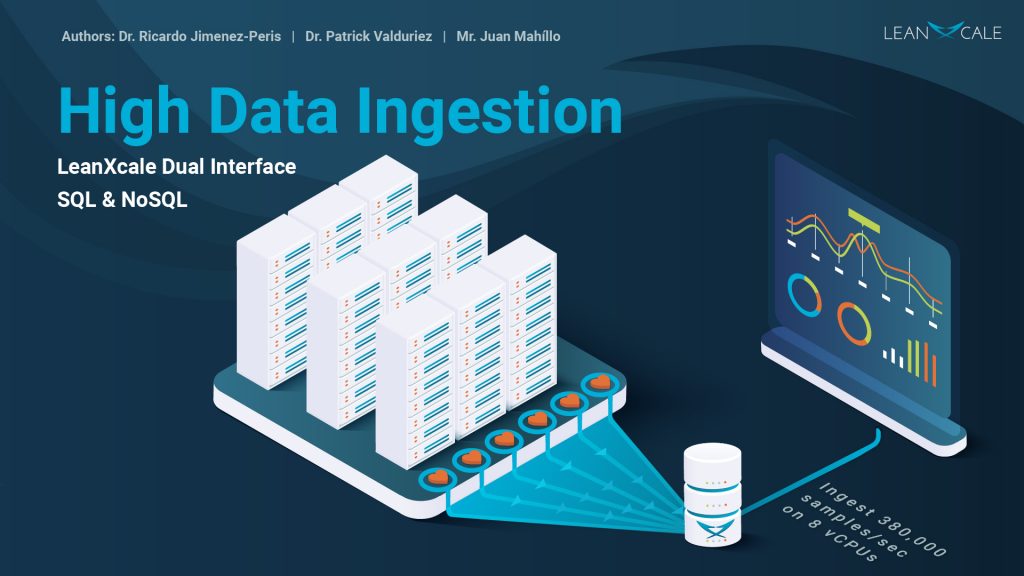
Inserts: Since the data is collected with a lot of time locality (i.e., rows with near timestamps arriving more or less around the same time), bidimensional partitioning takes full advantage of this fact. Fresh data is inserted, in its majority, into partitions that are fully in memory. As a result, intaking increases velocity (LeanXcale typically can ingest 400K records with a 4 core/32 GB server like AWS i3.2xlarge). Partitions are sized to enable the ingestion of delayed insertions at the same time as the regular data ingestion takes place.
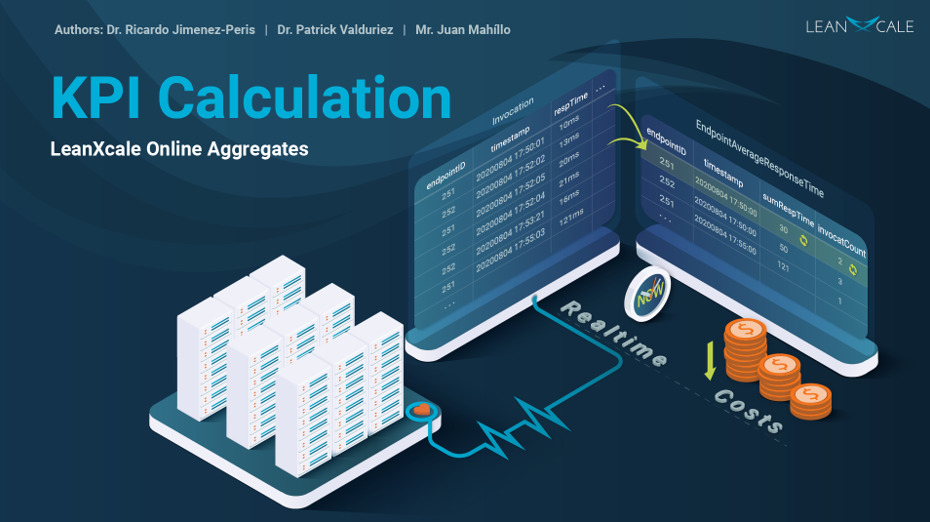
Queries: In a performance monitoring tool, most of the queries are related to a combination of time and range of items. Since the bidimensional partitioning uses these two criteria to define the partitions, and there is a lot of data locality in the query, the positive effect is that LeanXcale has to traverse a much smaller subset of data to solve the query. As a result, velocity and efficiency increase substantially. Additionally, the queries with a group clause (aggregations) are efficiently solved using another new LeanXcale technology: online aggregation (see online aggregation in monitoring blog post).
Deletes: Since deletion policies are time-oriented, they are defined by a retention time. The performance tool may drop a partition or a set of partitions as their retention time is reached. Since partitions contain data from a specific time range, this is very simple and effective.
Updates: Although they are uncommon, LeanXcale can still handle them efficiently by leveraging its writes cache that enables to amortize the IO to read a block from persistent storage across multiples rows.
Main Takeaways
Storing historical data hurts data management and makes it inefficient, as data ingestion consumes more and more resources with increased data volume and queries get less and less efficient with bigger data volumes.
LeanXcale bidimensional partitioning enables to store large data volumes, without hampering the performance of data ingestion and queries over these data. It partitions data across two dimensions, primary key and time. Each table partition is automatically split across the time dimension, before it gets too big and inefficient to insert and query data. In this way, data is ingested at a constant, fast speed, unlike SQL solutions that get slower at ingesting data as time passes and tables grow.
Additionally, the data partitions that get cold are evicted from the cache, keeping in its memory only the hot data that has been recently added or queried. Queries for monitoring data are based on the primary key used and the time interval and they are efficiently handled by highly reducing the amount of data to be traversed, basically scanning only the data that is relevant for the query.
Data that is not relevant anymore due to the passage of time can be very efficiently removed by dropping the regions containing the data from the corresponding time range.
Thus, LeanXcale manages to provide high efficiency in data ingestion and query processing for historical data by means of bidimensional partitioning.
As a result of all these features,
- LeanXcale reduces the TCO of the monitoring solution thanks to the efficiency improvement that results in a significant HW footprint reduction.
- Good user experience is provided for both the fresh and older data.
- The analytic capabilities boost up since they handle all the available information in a single database, and thus the MTTR can be shortened.
In other words, LeanXcale improves the general monitoring tool performance, making the depth of historical data transparent.
References
[Özsu & Valduriez 2020] Tamer Özsu, Patrick Valduriez. Principles of Distributed Database Systems, 4th Edition, Springer, 2020.
Related Blog Posts
About this blog series
This blog series aims at educating database practitioners on the differential features of LeanXcale, taking a deep dive into the technical and scientific underpinnings. The blog provides the foundations on which the new features are based and provides the reader with facts, allowing them to compare LeanXcale to existing technologies and learn its real capabilities.
About the authors
- Dr. Ricardo Jimenez-Peris is the CEO and founder of LeanXcale. Before founding LeanXcale, for over 25 years he was a researcher in distributed database systems, director of the Distributed Systems Lab and a university professor teaching distributed systems.
- Dr. Patrick Valduriez is a researcher at Inria, co-author of the book “Principles of Distributed Database Systems” that has educated legions of students and engineers in this field and, more recently, Scientific Advisor of LeanXcale.
- Mr. Juan Mahillo is the CRO of LeanXcale and a former serial Entrepreneur. After selling and integrating several monitoring tools for the biggest Spanish banks and telco with HP and CA, he co-founded two APM companies: Lucierna and Vikinguard. The former was acquired by SmartBear in 2013 and named by Gartner as Cool Vendor.
About LeanXcale
LeanXcale is a startup making an ultra-scalable NewSQL database that is able to ingest data at the speed and efficiency of NoSQL and query data with the ease and efficiency of SQL. Readers interested in LeanXcale can visit the LeanXcale website.